Functions in Hydrograph-py
After installation, the functions from the python package can be imported by:
from Hydrograph.hydrograph import sepBaseflow, filterpeaks, maxFlowVolStats

from Hydrograph.extreme_analysis import exceed, fitGEV, plotPDF, plotCDF, plotGEV
This imports all the functions that you might need for your hydrologrical analysis. The functions are described below.
sepBaseflow
The sepBaseflow function separates a time-series into baseflow and peakflow. Fills missing flow records by interpolation.
The input and output for this function are shown below.
def sepBaseflow(x, dt, A, k=0.000546, dt_max=None, tp_min=None):
    '''
    Separate a time-series into baseflow and peakflow. Fills missing flow records by interpolation.

    -----------------------------------------------------------------------------------------------
    Input:
        x:          Pandas dataframe with Index being a pandas datetime index and 'Date' label. Dataframe should.
                    contain one column for flow data, and should be labeled 'Total runoff [m^3 s^-1]'.
        dt:         Minimum time-step interval (in minutes) for analysing the data. Minute choices are 5, 15, or 60.
        k:          Slope of the dividing line; i.e. slope that defines when peakflow event starts and baseflow separation occurs.
                    Default is 0.000546  m^3 s^-1 km^-2 h^-1 (Hewlett and Hibbert 1967).
        A:          Catchment area in km^2 upstream of point of interest.
        dt_max:     Only interpolate over maximum number of consecutive NaN defined over time period dt_max in hours.
        tp_min:     Minimum duration of runoff peak in hours to be selected as being a peak.
    -----------------------------------------------------------------------------------------------
    Returns:
        df_final:    Pandas dataframe with datetime index and the following columns:
                        dt [hour]:                       Time difference in hours between two records.
                        Total runoff [m^3 s^-1]:         Recorded flow in cumecs for that timestamp.
                        Total runoff interp. [m^3 s^-1]: Interpolated recorded flow in cumecs.
                        Baseflow [m^3 s^-1]:             Calculated baseflow in cumecs for that timestamp.
                        Peakflow [m^3 s^-1]:             Calculated peakflow in cumecs for that timestamp.
                        Peak nr.:                        Peak number in sequence. Each peakflow event (i.e. flow above baseflow curve) is given a unique number
                                                         if it classifies as being a peak after filtering.
                        Peakflow starts:                 Timestamp when peakflow starts (moment when runoff peak exceeds baseflow curve).
                        Peakflow ends:                   Timestamp when peakflow ends (moment when runoff peak itersects again with baseflow curve).
                        Flow volume [m^3]:               Volume of the flow between two time-steps (total volume; i.e. baseflow + peakflow).
                        Max flow [m^3 s^-1]:             Maximum flow of peak flow event.
                        Date max. flow:                  Timestamp of maximum flow of peak flow event.
                        Tp [hour]:                       Time to peak.
    '''
filterpeaks
The filterpeaks function filters the peaks from the baseflow and assigns a peak nr. to it. Peaks are only assigned if they last at least as long as the tp_min threshold.
def filterpeaks(x, tp_min):
    '''
    Filters the peaks from the baseflow and assigns a peak nr. to it. Peaks are only
    assigned if they last at least as long as the tp_min threshold.

    --------------------------------------------------------------------------------
    Input:
        x:        Pandas dataframe with datetime index with 'Date' label and columns:
                    Peakflow [m^3 s^-1]    Peakflow in cumecs for that timestamp (=Total flow - baseflow).
                    dt [hour]              Time difference in hours between two records.
        tp_min:   Minimum duration of runoff peak in hours to be selected as being a peak.

    ---------------------------------------------------------------------------------
    Returns:
        df_final:    Pandas dataframe with datetime index and 'Peak nr.' as added column. Records for which no
                     peakflow nr. has been assigned are set to NaN for the 'Peakflow [m^3 s^-1]' column.
    '''
maxFlowVolStats
The maxFlowVolStats function calculates the annual maximum flow peak (crest) and maximum annual flow event volume for each year.
def maxFlowVolStats(df):
    '''
    Calculates the annual maximum flow peak (crest) and maximum annual flow volume for each year. The flow volume is calculated for each
    peakflow event. These events can be determined using the 'sepBaseflow' function. The volume for each event is calculated as the area
    under the total flow curve from the start till the end of the event.

    ------------------------------------------------------------------------------------------------------------------------------------
    Input:
        df:    Pandas dataframe with datetime index with 'Date' label and columns:
                  Date max. flow:                     Timestamp of maximum flow of peak flow event.
                  Max. flow [m^3 s^-1]:               Maximum crest flow of each identified flow peak.
                  Total runoff interp. [m^3 s^-1]:    Recorded (interpolated) flow in cumecs.
                  dt [hour]:                          Time difference in hours between two records.
                  Flow volume [m^3]:                  Volume of the flow between two time-steps (total volume; i.e. baseflow + peakflow).
                  Peak nr.:                           Assigned peak number to each flow peak.
    ------------------------------------------------------------------------------------------------------------------------------------
    Returns:
        vol_peak_combined:     Pandas dataframe with the following columns:
            Year max flow:                    Year for which the maximum annual peak flow and maximum annual peak flow volume are calculated.
            dt [hour]:                        Duration of the maximum flow peak in hours.
            Max. flow [m^3 s^-1]              Maximum peak flow of the maximum annual peak flow volume event.
            Total runoff interp. [m^3 s^-1]   Maximum prak flow of the maximum annual peak flow event.
            Avg. volume rate [m^3 s^-1]       Average flow rate of the maximum annual peak flow volume event (volume/duration).
            Flow volume [MCM]                 Maximum annual peak flow volume in MCM.
    '''


'''
exceed
The exceed function calculates the exceedance probability and return period for data in Pandas Series x.
def exceed(x):
    '''
    Calculates exceedance probability and return period for data in Pandas series x.
    '''
    x = np.sort(x)
    ind = np.arange(1,len(x)+1)
    nonexc = ind / (len(ind)+1)
    exc = 1 - nonexc
    T = 1/exc
    return exc, T
fitGEV
fitGEV fits a Generalized Extreme Value (GEV) distribution [3] to the data in x. GEV is fitted using the Maximum Likelihood Estimation method [2].
def fitGEV(x, Tmax):
    '''
    Fit a GEV distribution to the data in x. Inverse function values are calculateded for returnperiods up to Tmax.
    ---------------------------------------------------------------------------------------------------------------
    Input:
        x:        Pandas series of maxima
        Tmax:     Maximum return period to consider to fit GEV distribution for
    ---------------------------------------------------------------------------------------------------------------
    Returns:
        gev_fit:    Tuple of GEV fit parameters
        gev_inv:    Inverse of CDF for each T
    '''
plotPDF
plotPDF plots the Probability Density Function (PDF) of the data in x.
'''
Plot the PDF of data x.
----------------------------------------------------------
Input:
    x:        Pandas series
    gevfit:   Tuple with the three fitted GEV parameters
    bins:     Integer indicating number of bins or a numpy array with the bin edges
    xLabel:   Str label to use for x-axis
    Title:    Str chart title
    fname:    (Optional) Full path to filename to save the figure in *.png format
'''
An example plot is shown below.
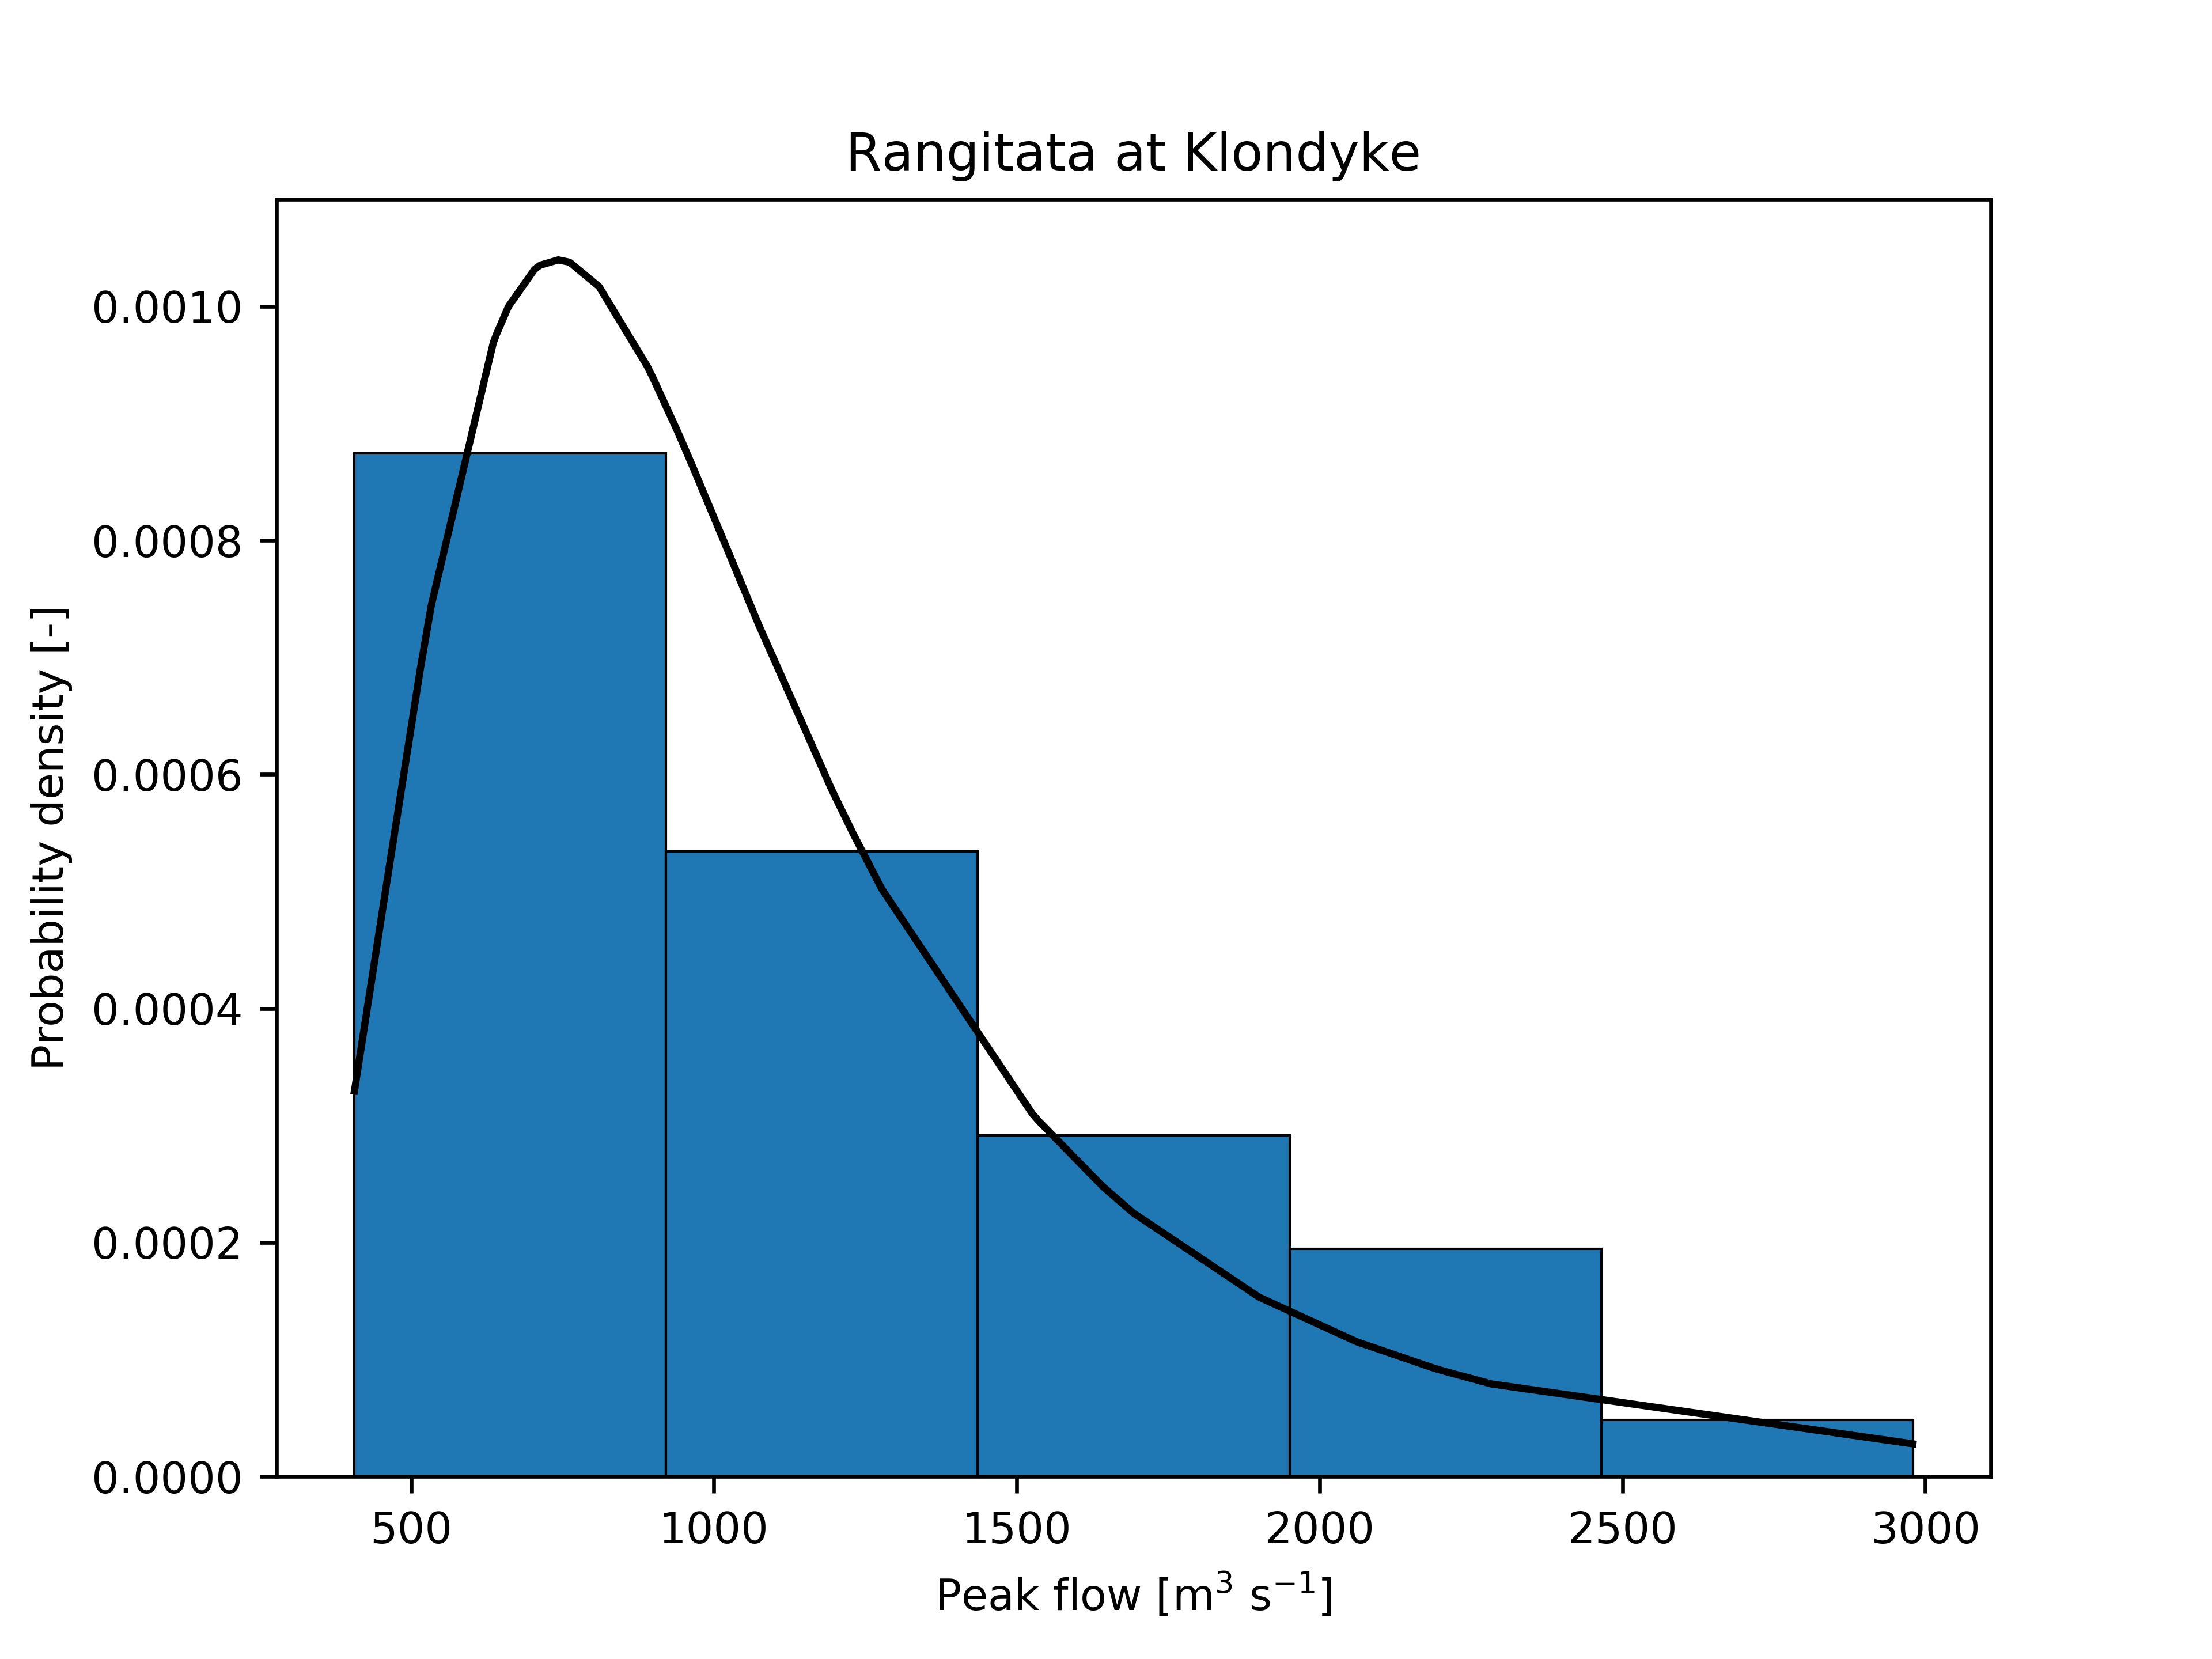
Figure 1 Example of Probability Density Function of maximum annual flows. The area (or integral) under the histogram will sum to 1. This is achieved by dividing the count by the number of observations times the bin width and not dividing by the total number of observations.
plotCDF
The plotCDF function plots the Cumulative Density Function (CDF) of the data in x.
def plotCDF(x, gevfit, e, xLabel, Title, EventFlow=None, EventT=None, EventLabel=None, fname=None):
    '''
    Plots CDF of data in Pandas Series x.
    -------------------------------------------------------------------------------------------
    Input:
        x:            Pandas series
        gevfit:       Tuple with the three fitted GEV parameters
        e:            Numpy array with exceedance probabilities
        xLabel:       Str label to use for x-axis
        Title:        Str chart title
        EventFlow:    (Optional) Flow of event that needs to be highlighted as a separate marker
        EventT:       (Optional) Return period of flow of event that needs to be highlighted as a separate marker
        EventLabel:   (Optional) Legend label of flow of event that needs to be highlighted as a separate marker
        fname:        (Optional) Full path to filename to save the figure in *.png format
    '''
An example plot is shown below.
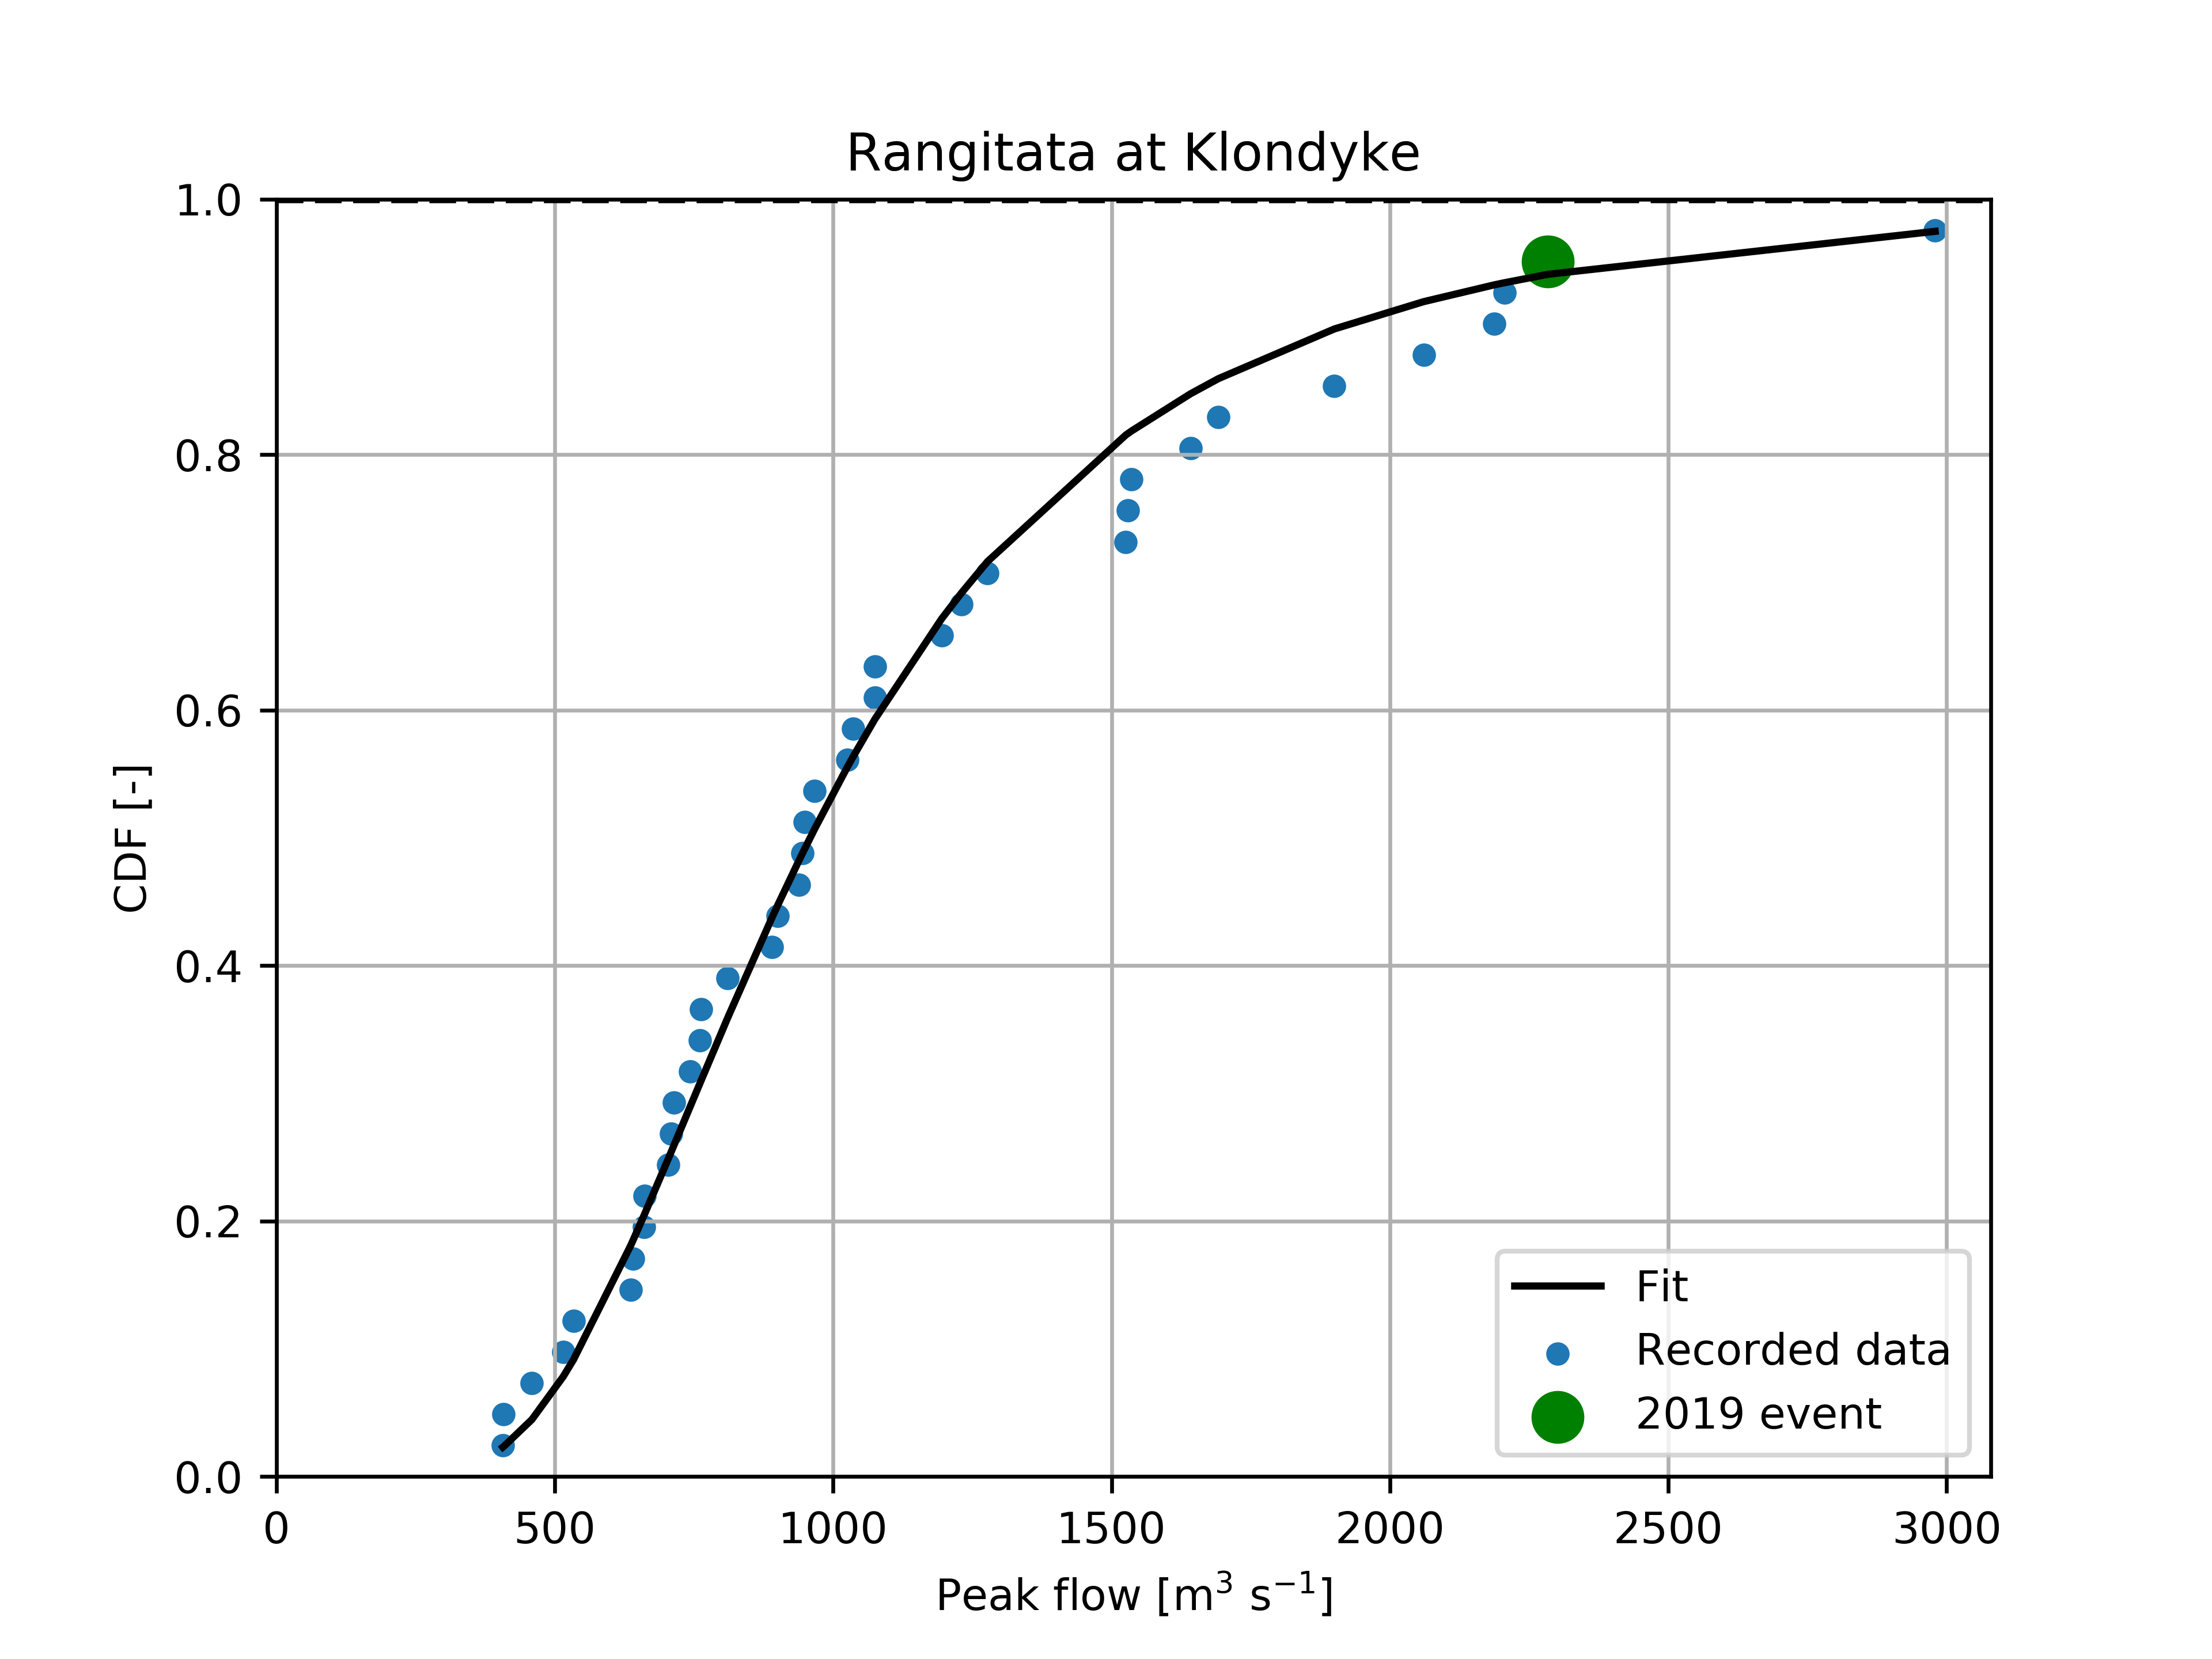
Figure 2 Example of Cumulative Density Function of maximum annual flows.
plotGEV
plotGEV plots the fitted GEV and data points for the returnperiods up to Tmax.
def plotGEV(x, t, gevinv, Tmax, yLabel, Title, EventFlow=None, EventT=None, EventLabel=None, fname=None):
    '''
    Plots GEV of data x.
    -------------------------------------------------------------------------------------------
    Input:
        x:            Pandas series of maxima
        t:            Exceedance return periods associated with data in x
        gevinv:       Inverse CDF for values associated with return periods up to Tmax
        Tmax:         Maximum return period to consider to fit GEV distribution for
        yLabel:       Str label to use for y-axis
        Title:        Str chart title
        EventFlow:    (Optional) Flow of event that needs to be highlighted as a separate marker
        EventT:       (Optional) Return period of flow of event that needs to be highlighted as a separate marker
        EventLabel:   (Optional) Legend label of flow of event that needs to be highlighted as a separate marker
        fname:        (Optional) Full path to filename to save the figure in *.png format
    '''
An example plot is shown below.
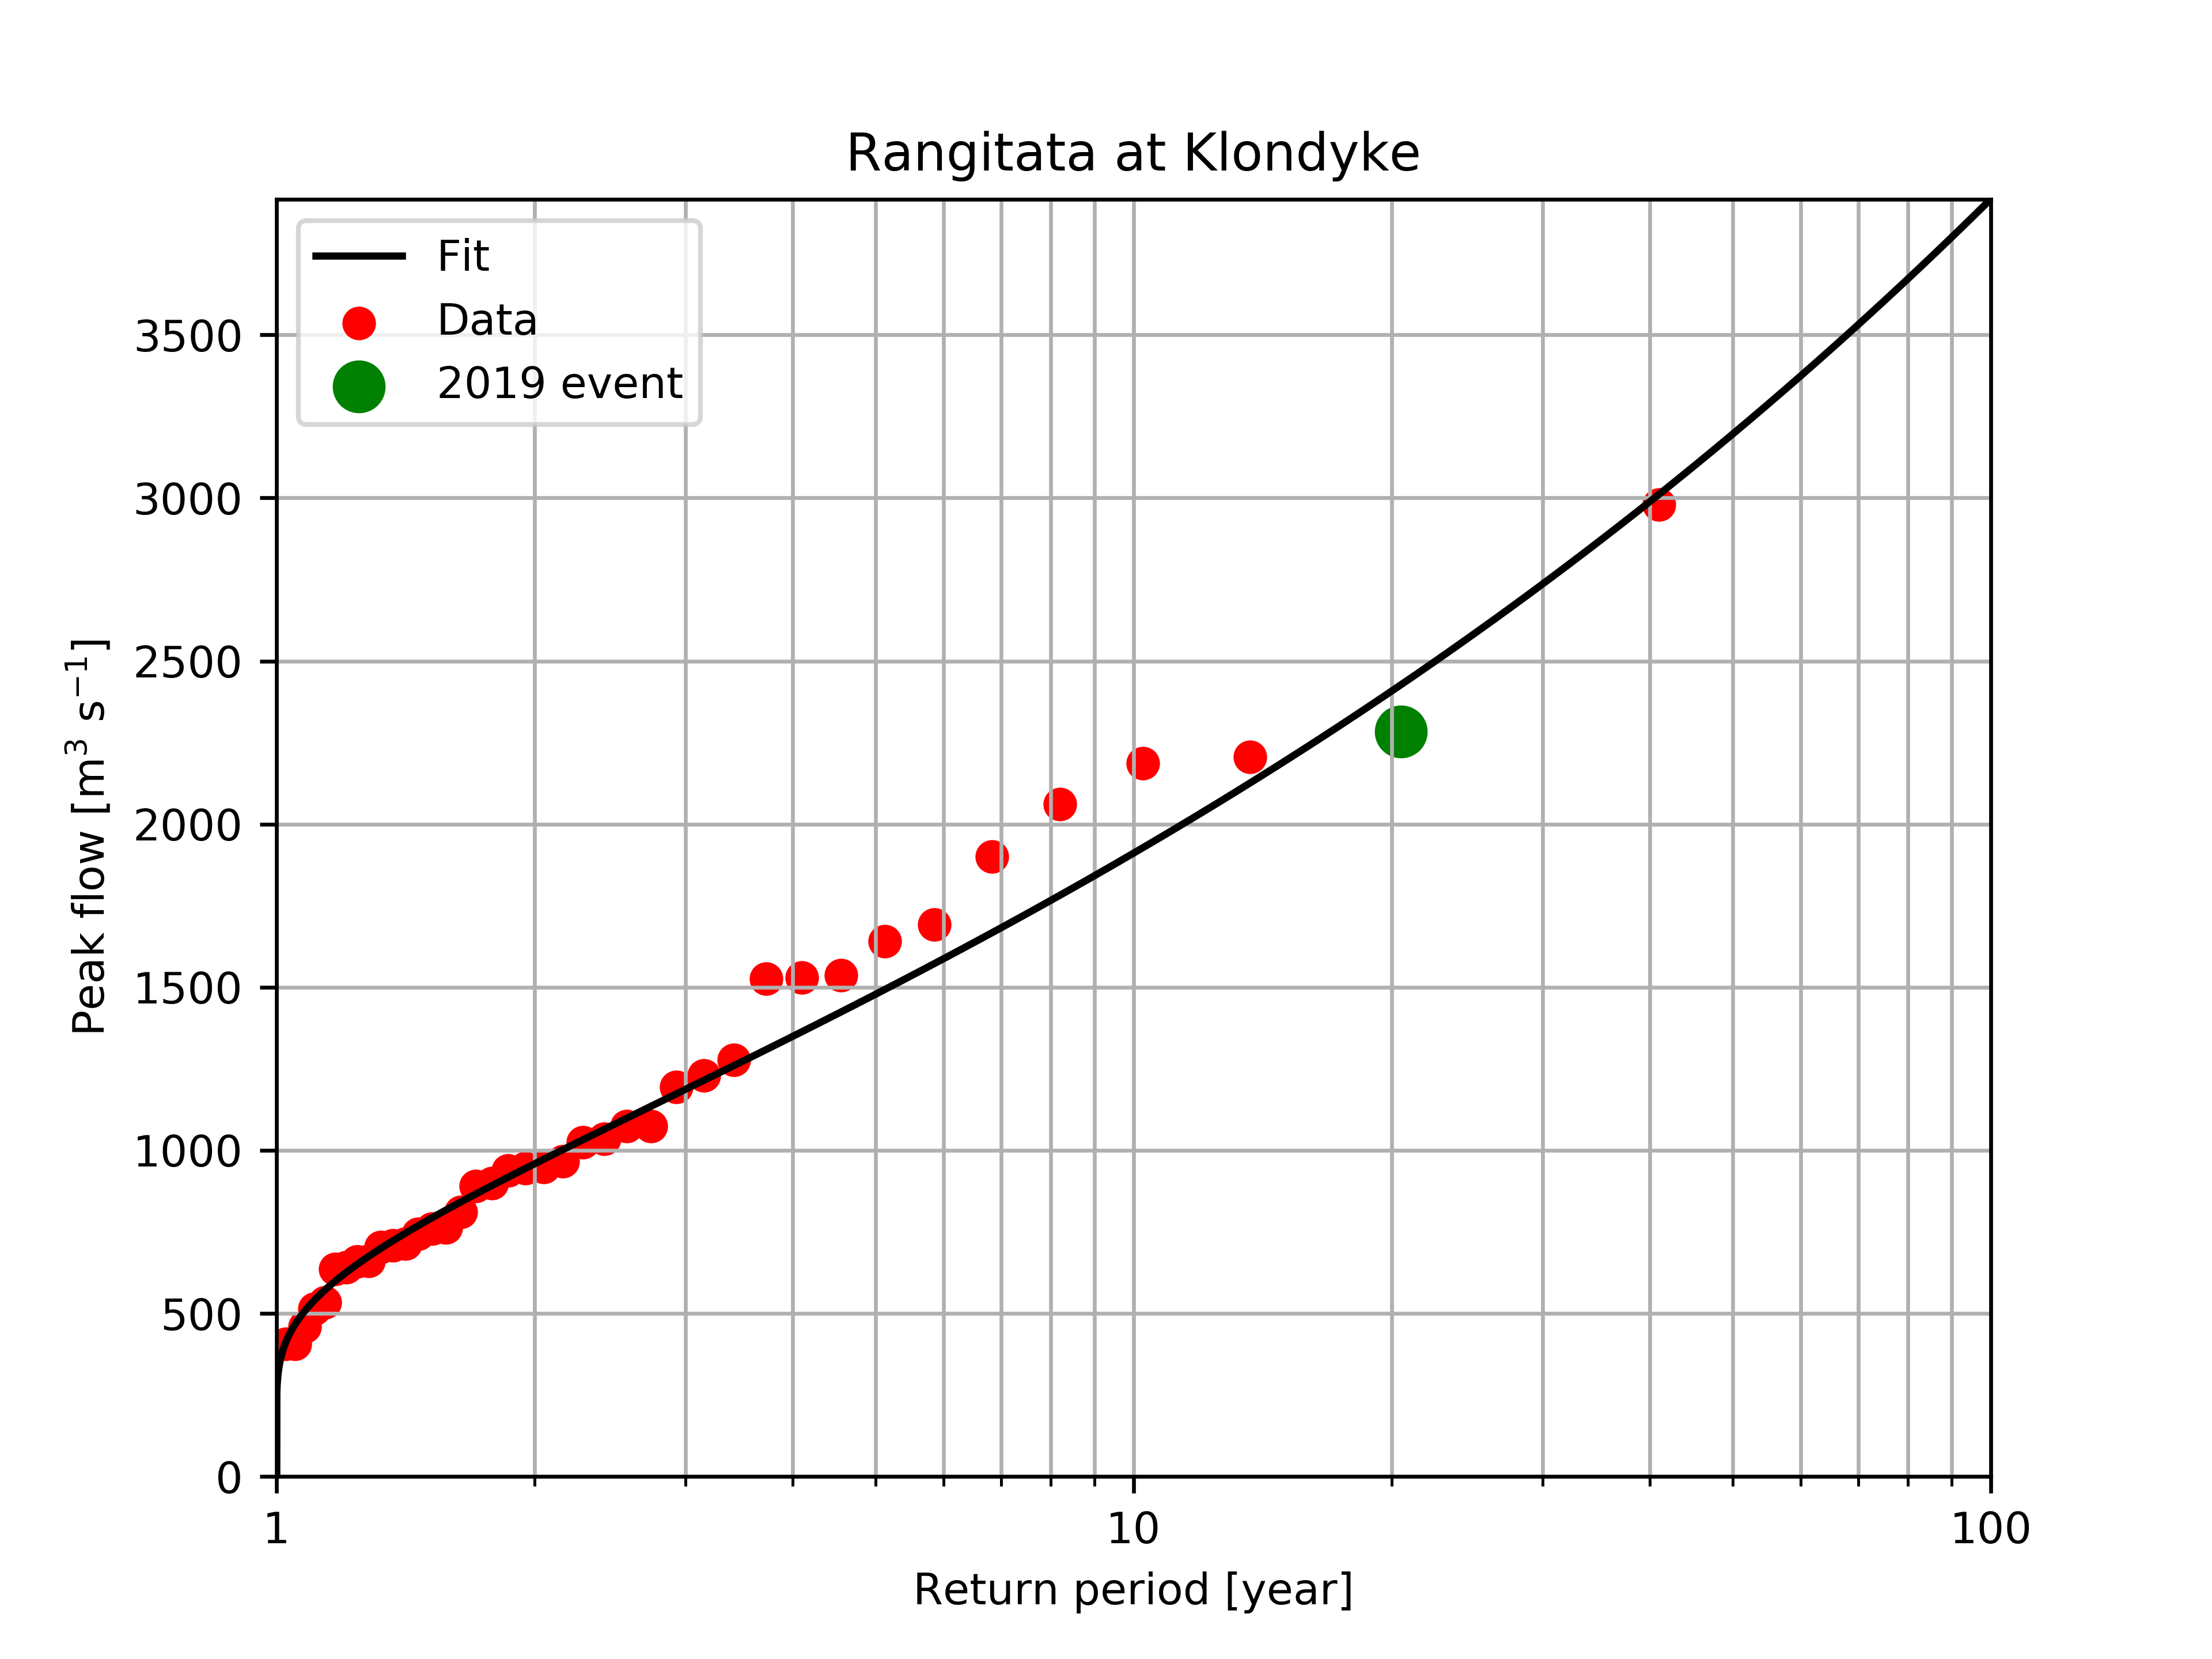
Figure 3 Example of GEV fit and data points versus return periods.